How an Explainable AI Model Found $219K in Trapped Floorplan Capital
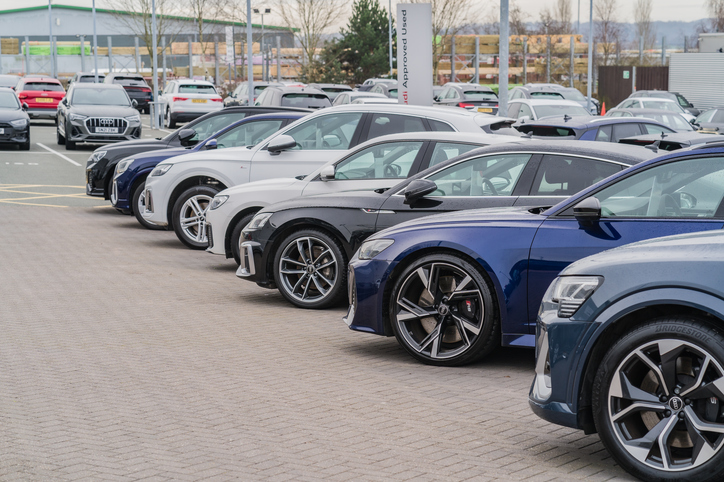
A large regional auto group came to us with a question: why is this vehicle still sitting on the lot? I analyzed their full new and used inventory as of May 2026, everything from compact sedans to heavy duty commercial trucks, across five store locations and several brands.
I've anonymized the dealer group and store names for this write up; the underlying data and results are real.
Each record includes the fundamentals an inventory manager already tracks: new versus used, model year, make, model, body style, MSRP, cost, lot price, mileage, transmission, interior color, and dealer location. It's exactly the kind of operational data most dealer groups already have, which makes it a good question every used and new car operation eventually runs into: are we actually managing what's driving days on lot?
From Raw Data to a Working Model in Minutes
Using Intelligible's Summand platform, I loaded the raw inventory export, built a training view around days on lot as the target, and kicked off model training. When using Intelligible's glass-box modeling, the platform trains an Explainable Boosting Machine, or EBM, so that every prediction can be decomposed into individual, auditable feature contributions rather than a single opaque accuracy score.
The baseline across all inventory was about 89 days on lot. The EBM's job was to explain, in days above or below that baseline, exactly what each factor was contributing while holding everything else constant. That last part matters. A dealership's own average days by category dashboard can tell you trucks average more days than sedans, but it can't tell you whether that's because of the vehicle type itself, or because trucks also happen to be pricier, older, or concentrated at a slower store.
What the Model Revealed
New versus used is the single strongest factor. New vehicles push predicted aging 25.5 days above the baseline. Used vehicles pull it 64.4 days below. The used vehicle operation is turning efficiently. Almost all of the trapped capital is sitting in new inventory, a distinction a blended average days on lot figure completely erases.
Model year acts like a cliff, not a slope. 2025 model year units run 21 days below average. They're moving well. 2024 model year units jump to 53 to 57 days above average, and 2023 and older units are worse still, at 38 to 94 days. The jump isn't gradual, it's a cliff between current year and prior year stock, and that tells the dealer exactly where to draw the line for an aged unit blitz.
Lot price has a non-linear dead zone. Vehicles priced below $25K move quickly, 13 to 18 days faster than average. Vehicles priced above $65K also move fast, 18 to 43 days faster. Luxury buyers tend to know what they want. But the $35K to $50K band peaks at 44 days above average. That's the mid market no man's land where buyers cross shop endlessly. A simple average of price versus days on lot would show something close to flat and completely hide this dip in the middle.
None of this is inferred or approximated. It's read directly from the model's learned shape functions, with confidence intervals that widen where inventory is thin, so the dealer group knows where to trust the number and where to treat it as directional.
Where Dashboard Averages Get It Wrong
Say an inventory manager runs the standard report: average days on lot, grouped by store location. One store, the busiest, highest volume location, looks fine on paper. Another, smaller store shows elevated average days, and the obvious read is that the store just has a tougher inventory mix: too many trucks, too many EVs, too many high dollar units.
The model tells a different story. After the EBM controls for vehicle mix, pricing, model year, and everything else, one store still contributes 37.8 days to predicted aging, independent of what it's stocked with. That's not a product mix problem. It's something about that specific store: merchandising, photos, pricing authority, lot visibility, or staffing. Meanwhile the model's best performing store contributes 6.3 fewer days after the same controls, which makes it the internal benchmark to study rather than a store that just got lucky with easier inventory.
A store level average conflates what a store happens to be stocked with and how that store performs. Separating the two isn't something a GROUP BY can do on its own, because the inventory mix and the operational performance are tangled together in the raw number.
A Model You Build Once and Keep Asking Questions
Once the model is trained, it becomes a persistent, reusable layer the dealer group can query conversationally. Ask which vehicles are structurally slow, and get a ranked list of nameplates whose aging can't be explained by price or age alone: commercial trucks with no retail demand, EV models oversupplied relative to actual demand, sedans that structurally add days no matter their condition. Ask what's driving one store's aging, and get the isolated store effect, separate from its inventory mix. Ask what happens if you cut price by $3,000 on a specific unit, and get a direct read from the lot price shape function.
That's a real shift from filing a new report request every time a district manager has a new question. The model holds the full multivariate structure, vehicle, pricing, timing, and location, all interacting, in memory. The conversation just navigates it.
Building Agentic Workflows on a Grounded Layer
For a multi store dealer group, the trained model isn't just for a one time analysis. It becomes infrastructure. Incoming inventory can be scored automatically the moment it hits the lot, flagging units entering the $35K to $50K dead zone or arriving as prior model year stock before they've aged a single day. Ordering guides can be updated on a rolling basis to cap allocation of structurally slow moving trims. Store level performance can be monitored continuously for drift, instead of revisited once a quarter.
Because every prediction decomposes into additive, dollar and day feature contributions, the group's floorplan cost math inherits that same transparency. Instead of “this truck has been on the lot too long,” the system can say this unit is carrying $58K in annual floorplan cost, driven by 35 to 44 days of model specific aging, on a body style the group should stop ordering on spec. That specificity is what turned an inventory review into a prioritized, five action plan, and what let us put a real number on it: roughly $219,000 in annual floorplan cost tied to identified slow moving units.
Who This Is For
Dealer principals and GMs managing multiple stores and brands, who need to know whether a store's aging problem is a mix problem or a management problem before deciding where to step in.
Inventory and used car managers who are tired of reacting to whichever unit is oldest today, and want to know which factors are actually driving days on lot so they can fix the pipeline instead of just the symptom.
OEM allocation and ordering teams who want future orders informed by which model year, price band, and trim combinations actually turn, rather than by last year's order guide.
The common thread I keep seeing: anyone managing floorplan cost across more than one dimension, vehicle, price, timing, location, who needs to know which one is actually the problem, and needs an answer specific enough to act on this week.
Why This Matters
The store level example above isn't a one off. It's representative of a pattern I see in almost every dataset I look at: a blended average hides whether a number comes from the mix or from performance, and a raw price to days relationship hides the non linear dead zones where inventory actually gets stuck. In a dealer group, that ambiguity costs real money. In this case, a specific, defensible estimate of $219,000 in annual floorplan cost sitting in identifiable, actionable units.
A dealer group should not have to hire a data science team or stand up a BI pipeline to get this kind of clarity. Intelligible gives them a trained, inspectable model through a conversational experience that meets an inventory manager where they already are, asking which units to move first, and getting an answer grounded in what's actually driving the aging, down to the specific store, model, and price band.
Built with Intelligible. Data provided by a large regional auto dealer group in May 2026; names have been anonymized.